


Market Insight- Global Geomatics Market Overview 2026
Global Geomatics Market Was Valued at USD 10.026 Billion in 2025 and is Expected to Reach USD 20.392 Billion by the End of 2035, Growing at a CAGR of 7.36% Between 2025 and 2035.– Bossonresearch.com
Geomatics covers the acquisition, modelling, analysis, and delivery of spatially referenced information. The commercial stack runs from survey-grade GNSS receivers, total stations, and 3D laser scanners at the hardware end, through GIS, photogrammetry, and point-cloud platforms in software, to cadastral mapping and geospatial analytics delivered as services. Its output sits underneath construction layout, land administration, utility asset records, autonomous navigation, and defence-grade Earth observation, so demand tracks public infrastructure budgets and satellite constellations as closely as it tracks private construction cycles.
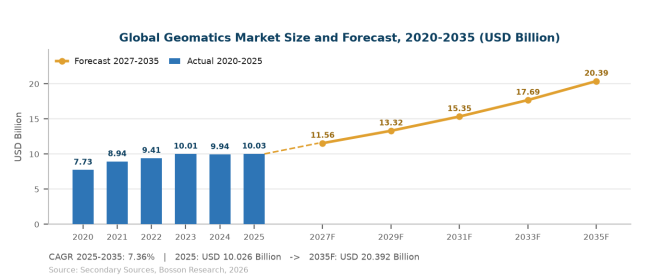
In 2025, the global geomatics solutions market reached USD 10.026 billion and is projected to expand to USD 20.392 billion by 2035, growing at a CAGR of 7.36%. The industry is moving from recovery toward structural growth, driven by expanding end-market demand, rising adoption across key applications, and a structural shift toward higher-value, customized solutions.
However, despite its long-term potential, the geomatics solutions market faces multiple structural challenges. Rising input, labor, and energy costs are compressing margins across the value chain; the highly globalized and time-sensitive supply chain remains vulnerable to disruption; and stringent technical and regulatory requirements force continuous trade-offs between quality, variety, and cost efficiency.
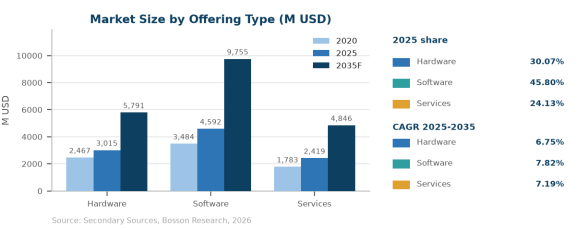
The geomatics solutions market is primarily segmented by offering type into Hardware, Software, Services. Software remains the dominant segment, accounting for 45.80% of the global market in 2025, while Software exhibits the fastest growth with a CAGR of 7.82% through 2035, reflecting the recovery of high-value demand.
Table 1 Global geomatics solutions market by offering type, 2025 and 2035F (US$ million)
|
Segment |
2025 |
2035F |
Share 2025 |
CAGR 25-35 |
|---|---|---|---|---|
|
Hardware |
3,015 |
5,791 |
30.07% |
6.75% |
|
Software |
4,592 |
9,755 |
45.80% |
7.82% |
|
Services |
2,419 |
4,846 |
24.13% |
7.19% |
|
Total |
10,026 |
20,392 |
100.00% |
7.36% |
Source: Bosson Research analysis, 2026.
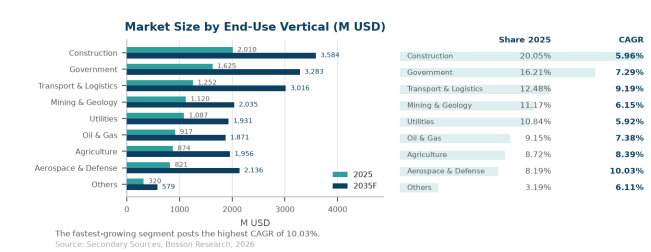
From an application perspective, the market is segmented into Construction, Government, Transport & Logistics, Mining & Geology, Utilities, Oil & Gas, Agriculture, Aerospace & Defense, Others. Construction accounts for 20.05% of the market in 2025 as the core revenue base, while Aerospace & Defense is the fastest-growing segment with a CAGR of 10.03%, driven by rapid adoption and value-added monetization.
Table 2 Global geomatics solutions market by application, 2025 and 2035F (US$ million)
|
Application |
2025 |
2035F |
Share 2025 |
CAGR 25-35 |
|---|---|---|---|---|
|
Construction |
2,010 |
3,584 |
20.05% |
5.96% |
|
Government |
1,625 |
3,283 |
16.21% |
7.29% |
|
Transport & Logistics |
1,252 |
3,016 |
12.48% |
9.19% |
|
Mining & Geology |
1,120 |
2,035 |
11.17% |
6.15% |
|
Utilities |
1,087 |
1,931 |
10.84% |
5.92% |
|
Oil & Gas |
917 |
1,871 |
9.15% |
7.38% |
|
Agriculture |
874 |
1,956 |
8.72% |
8.39% |
|
Aerospace & Defense |
821 |
2,136 |
8.19% |
10.03% |
|
Others |
320 |
579 |
3.19% |
6.11% |
|
Total |
10,026 |
20,391 |
100.00% |
7.36% |
Source: Bosson Research analysis, 2026.
Geographically, North America remains the largest market with 32.37% of global revenue in 2025, followed by Europe at 29.73%. Asia-Pacific emerges as the primary growth engine, expanding at a leading CAGR of 10.84% through 2035, driven by rapid demand growth, expanding capacity, and improving connectivity.
Table 3 Global geomatics solutions market by region, 2025 and 2035F (US$ million)
|
Region |
2025 |
2035F |
Share 2025 |
CAGR 25-35 |
|---|---|---|---|---|
|
North America |
3,246 |
5,587 |
32.37% |
5.58% |
|
Europe |
2,981 |
5,017 |
29.73% |
5.34% |
|
Asia-Pacific |
2,683 |
7,511 |
26.76% |
10.84% |
|
South America |
418 |
881 |
4.17% |
7.75% |
|
Middle East and Africa |
698 |
1,396 |
6.97% |
7.17% |
|
Total |
10,026 |
20,392 |
100.00% |
7.36% |
Source: Bosson Research analysis, 2026.
Geomatics Industry Chain Analysis
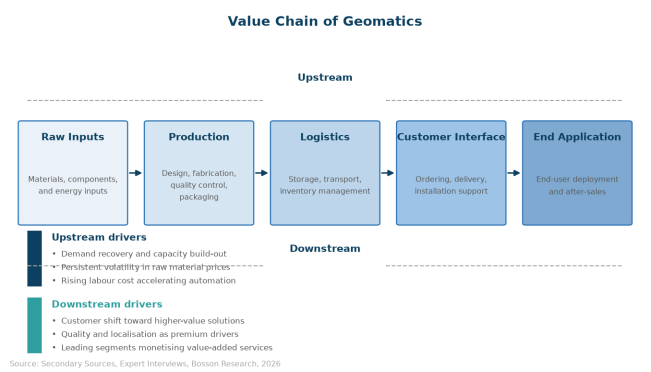
Service Process Analysis of Geomatics
Solution Planning and Delivery
Geomatics planning begins with scope definition that balances customer requirements, application-specific needs, and market positioning. Teams build offerings around technical standards, cost targets, and the operational constraints of the value chain, translating market trends into scalable, standardized solutions.
Delivery capability takes shape in dedicated facilities and qualified delivery teams, where engagements are scoped, reviewed, and staged under strict quality protocols. Industry-standard quality systems govern process control and verification, while modular configurations increasingly replace rigid delivery models to match evolving customer expectations.
Digital tooling now shapes this stage as well: demand forecasting, specification data, and planning systems improve resource allocation and delivery accuracy, while automation helps providers absorb rising labor costs and handle growing delivery complexity.
Once engagements are confirmed, they move through documentation, inspection, and staged release before dispatch, with real-time tracking and quality checkpoints protecting integrity up to the point of delivery.
Logistics and Customer Delivery
Logistics is the connective tissue of the geomatics solutions value chain. Coordinated schedules and strategically located resources ensure solutions reach customers on time, while program management preserves quality across the entire journey from provider to end user.

Development Trends
Onboard delivery then turns the prepared solution into a working service. Delivery teams configure, deploy, and support solutions within customer operating constraints, delivering everything from full-service engagements to flexible, on-demand offerings.
Across both stages, sustainability is becoming a core operating criterion: resource efficiency, environmental compliance, and traceability systems are now mainstream requirements for providers competing for contracts.
The result is a tightly integrated system in which solution design, delivery, logistics, and customer support must operate as one continuous, quality-assured process.
Leading Players Enter High-Growth Trajectory
The period from 2025 to 2026 marks a critical turning point for the geomatics solutions industry. Leading players are entering a high-growth trajectory, expanding capacity, winning new contracts, and extending their geographic reach through acquisitions and long-term partnerships.
Digital transformation is running in parallel. Rising labor costs and increasingly stringent customer requirements are pushing operators to adopt automation, AI-driven demand forecasting, and data-based supply chain management, reshaping the industry from a traditional labor-intensive business into a more intelligent, precision-driven operation.
Sustainability is moving from a peripheral public-relations commitment to a core competitive factor, with resource and environmental management now central to procurement decisions and to the operational upgrades taking place across the value chain.
Against this backdrop, the geomatics solutions market is evolving from a standard industry input into a strategic growth engine. Leading players are investing in capacity, technical talent, and digital platforms to convert products into higher value per customer, while the same forces are redrawing the geographic balance of the industry as new demand corridors take shape.
Global Growth Poles Shift Eastward and Northwest
With the recovery of global demand and the re-expansion of cross-border activity, demand for geomatics solutions is shifting geographically. Asia-Pacific stands out as the fastest-growing region, while mature markets in Europe and North America continue to anchor global volume.
Cost pressure and value-added mix run in parallel across the industry. In an environment of input inflation and rising energy prices, operators must control costs while simultaneously upgrading product quality to meet rising customer expectations, a tension that is reshaping offerings, sourcing strategies, and service models.
Customer preferences are also recalibrating: authenticity is becoming a decisive driver of demand, with a large share of global consumers willing to pay a premium for locally sourced, higher-quality options, pushing producers toward more experiential and culturally resonant solutions.
Global Demand Recovery and Market Competition
The core driver of the geomatics solutions market stems from the strong recovery of end-market demand, which maintains a direct relationship with product volume. The rebound in core applications, together with rising utilization, continues to expand both the volume and the per-unit value of consumption.
Intensified competition amplifies the effect. As customers differentiate on quality and service, products have become a strategic brand tool rather than a basic cost item. Leading players leverage premium offerings to reinforce brand value, while challengers monetize value-added services as an ancillary revenue stream.
End-market expansion adds further momentum. The rising share of high-value applications increases product complexity and value density per unit, strengthening demand for quality logistics and premium inputs and raising the strategic importance of the market across the industry.
Operational Transformation Driven by Digitalisation and AI
Digitalisation and AI are reshaping operations end to end. Demand forecasting, automated workflows, predictive analytics, and data-driven supply chain management improve efficiency, reduce rework, and optimize cost structures.
This operational transformation is particularly important as labor costs rise and solution complexity grows. Automation and robotics allow leading players to absorb cost pressure while smaller operators face margin deterioration and consolidation pressure, accelerating industry concentration.
The strategic consequence is that the market is shifting from a traditional service cost center toward a value-generating capability, one that supports customer satisfaction and incremental revenue at the same time.
Demand Structural Upgrade and Premiumisation
Rapid changes in customer demand are raising product and operational requirements. Customers increasingly expect higher-quality, better-integrated, outcome-oriented options and branded, experience-oriented solutions that reflect their evolving preferences.
This structural upgrade is pushing the supply chain from standardized delivery toward highly customized systems, increasing solution complexity and raising the value of flexible, data-driven planning and inventory management.
For providers that manage the transition well, a higher-value mix creates clear opportunities to raise revenue per customer and to differentiate against competitors, converting a cost item into a source of strategic advantage.
Taken together, these drivers reinforce one another: demand recovery provides volume, competition raises strategic importance, digital tools cut cost, and demand upgrading lifts value, keeping the market on a steady structural growth path.
Global Geomatics Market: Competitive Landscape
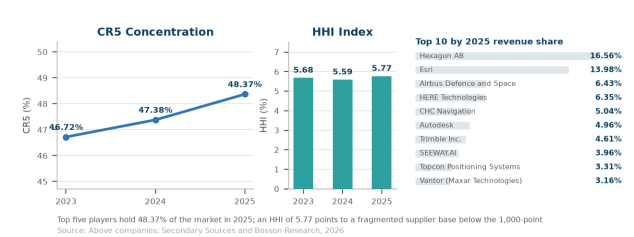
The global geomatics solutions sector exhibits a moderately to highly concentrated competitive structure. The CR5 ratio stood at 48.37% in 2025 while the HHI reached 5.77%, indicating a leader-dominated but regionally dynamic market. Hexagon AB leads with a 16.56% revenue share, followed by Esri at 13.98% and Airbus Defence and Space at 6.43%.
Table 4 Global geomatics solutions market concentration, 2025 (revenue share and HHI)
|
Company |
2023 |
2024 |
2025 |
Type |
|---|---|---|---|---|
|
Hexagon AB |
17.31% |
16.93% |
16.56% |
Tier 1 |
|
Esri |
13.35% |
12.91% |
13.98% |
Tier 1 |
|
HERE Technologies |
6.69% |
7.06% |
6.35% |
Tier 2 |
|
Airbus Defence and Space |
5.59% |
5.93% |
6.43% |
Tier 2 |
|
CHC Navigation |
3.78% |
4.55% |
5.04% |
Tier 2 |
|
CR5 |
46.72% |
47.38% |
48.37% |
|
|
HHI |
5.68% |
5.59% |
5.77% |
|
Source: Bosson Research analysis, 2026.
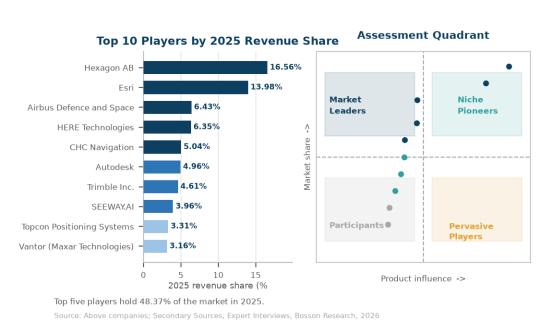
Key players in the Geomatics Market include:
Esri
Airbus Defence and Space
HERE Technologies
CHC Navigation
Autodesk
Trimble Inc.
SEEWAY.AI
Others
Request for more information
Click to view the full report TOC, figure and tables: https://www.bossonresearch.com/yjbg
About US:
Bosson Research (BSR) is a leading market research and consulting company, provides market intelligence, advisory service and market research reports for the automobile, electronics and semiconductor, and consumer good industry. The company assists its clients to strategize business policies and achieve sustainable growth in their respective market domain.
Bosson Research provides one-stop solution right from data collection to investment advice. The analysts at Bosson Research (BSR) dig out factors that help clients understand the significance and impact of market dynamics. Bosson Research (BSR) bring together the deepest intelligence across the widest set of capital-intensive industries and markets. By connecting data across variables, our analysts and industry specialists present our customers with a richer, highly integrated view of their world.
Contact US:
Tel: +86 400-166-9288
E-mail: sales@bossonresearch.com
