





Global Geomatics Market Research Report 2026 (Status and Outlook)

Geomatics is the industrial discipline of measuring, mapping, and managing the physical world in digital form. Hardware captures position and geometry, software turns those measurements into structured spatial models, and services apply them to land registration, infrastructure delivery, and asset operation. Because the same reference framework serves surveyors, utilities, defence agencies, and autonomous vehicle programmes, the market behaves less like a single equipment category and more like shared infrastructure that many industries draw on at once.

In 2025, the global geomatics solutions market reached USD 10.026 billion and is projected to expand to USD 20.392 billion by 2035, growing at a CAGR of 7.36%. The industry is moving from recovery toward structural growth, driven by expanding end-market demand, rising adoption across key applications, and a structural shift toward higher-value, customized solutions.
However, despite its long-term potential, the geomatics solutions market faces multiple structural challenges. Rising input, labor, and energy costs are compressing margins across the value chain; the highly globalized and time-sensitive supply chain remains vulnerable to disruption; and stringent technical and regulatory requirements force continuous trade-offs between quality, variety, and cost efficiency.
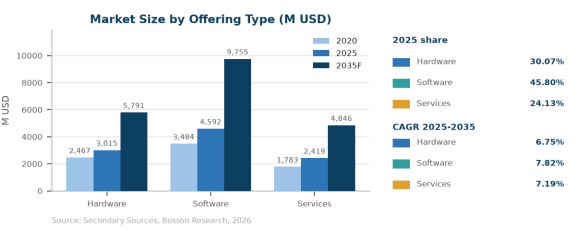
The geomatics solutions market is primarily segmented by offering type into Hardware, Software, Services. Software remains the dominant segment, accounting for 45.80% of the global market in 2025, while Software exhibits the fastest growth with a CAGR of 7.82% through 2035, reflecting the recovery of high-value demand.
Table 1 Global geomatics solutions market by offering type, 2025 and 2035F (US$ million)
Segment | 2025 | 2035F | Share 2025 | CAGR 25-35 |
|---|---|---|---|---|
Hardware | 3,015 | 5,791 | 30.07% | 6.75% |
Software | 4,592 | 9,755 | 45.80% | 7.82% |
Services | 2,419 | 4,846 | 24.13% | 7.19% |
Total | 10,026 | 20,392 | 100.00% | 7.36% |
Source: Bosson Research analysis, 2026.
From an application perspective, the market is segmented into Construction, Government, Transport & Logistics, Mining & Geology, Utilities, Oil & Gas, Agriculture, Aerospace & Defense, Others. Construction accounts for 20.05% of the market in 2025 as the core revenue base, while Aerospace & Defense is the fastest-growing segment with a CAGR of 10.03%, driven by rapid adoption and value-added monetization.
Table 2 Global geomatics solutions market by application, 2025 and 2035F (US$ million)
Application | 2025 | 2035F | Share 2025 | CAGR 25-35 |
|---|---|---|---|---|
Construction | 2,010 | 3,584 | 20.05% | 5.96% |
Government | 1,625 | 3,283 | 16.21% | 7.29% |
Transport & Logistics | 1,252 | 3,016 | 12.48% | 9.19% |
Mining & Geology | 1,120 | 2,035 | 11.17% | 6.15% |
Utilities | 1,087 | 1,931 | 10.84% | 5.92% |
Oil & Gas | 917 | 1,871 | 9.15% | 7.38% |
Agriculture | 874 | 1,956 | 8.72% | 8.39% |
Aerospace & Defense | 821 | 2,136 | 8.19% | 10.03% |
Others | 320 | 579 | 3.19% | 6.11% |
Total | 10,026 | 20,391 | 100.00% | 7.36% |
Source: Bosson Research analysis, 2026.

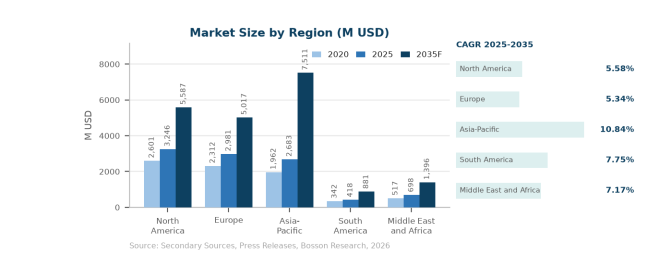
Geographically, North America remains the largest market with 32.37% of global revenue in 2025, followed by Europe at 29.73%. Asia-Pacific emerges as the primary growth engine, expanding at a leading CAGR of 10.84% through 2035, driven by rapid demand growth, expanding capacity, and improving connectivity.
Table 3 Global geomatics solutions market by region, 2025 and 2035F (US$ million)
Region | 2025 | 2035F | Share 2025 | CAGR 25-35 |
|---|---|---|---|---|
North America | 3,246 | 5,587 | 32.37% | 5.58% |
Europe | 2,981 | 5,017 | 29.73% | 5.34% |
Asia-Pacific | 2,683 | 7,511 | 26.76% | 10.84% |
South America | 418 | 881 | 4.17% | 7.75% |
Middle East and Africa | 698 | 1,396 | 6.97% | 7.17% |
Total | 10,026 | 20,392 | 100.00% | 7.36% |
Source: Bosson Research analysis, 2026.
Geomatics Industry Chain Analysis

Service Process Analysis of Geomatics
Product Planning and Production
Geomatics planning begins with scope definition that balances customer requirements, application-specific needs, and market positioning. Delivery capability takes shape in dedicated facilities and qualified teams, where engagements are scoped, reviewed, and staged under controlled conditions.
Digital tooling now shapes this stage as well: demand forecasting, specification data, and planning systems improve resource allocation and delivery accuracy, while automation helps providers absorb rising labor costs and handle growing delivery complexity.
Once engagements are confirmed, they move through documentation, inspection, and staged release before dispatch, with real-time tracking and quality checkpoints protecting integrity up to the point of delivery.
Logistics and customer delivery complete the value chain. Coordinated schedules and qualified delivery resources ensure solutions reach customers on time, while delivery teams configure, deploy, and support offerings within customer operating constraints, delivering everything from full-service engagements to flexible on-demand offerings.
Logistics and Customer Delivery
Logistics is the connective tissue of the geomatics solutions value chain. Program management preserves quality from provider to end user, and customer delivery turns the prepared solution into a working capability that reinforces market positioning and drives satisfaction.
Development Trends
Leading Players Enter High-Growth Trajectory
The first structural shift is from periodic survey to continuous update. Satellite constellations operated by Planet Labs, ICEYE, BlackSky, and Maxar shorten revisit intervals to hours, while mobile mapping rigs and survey drones let operators refresh street-level geometry on demand. That changes the commercial model: buyers no longer purchase a map, they subscribe to a stream of corrections, which raises the value of the software layer and lowers the strategic weight of any single instrument sale.
Digital transformation is running in parallel, with automation, AI-driven demand forecasting, and data-based supply chain management reshaping the industry from a labor-intensive business into a more intelligent, precision-driven operation.
Sustainability is moving to the core of operations, with resource and environmental management becoming decisive competitive factors in procurement.
Against this backdrop, the geomatics solutions market is evolving from a standard industry input into a strategic growth engine, with leading players investing in capacity, technical talent, and digital platforms while the geographic balance of the industry is redrawn around new demand corridors.
Global Growth Poles Shift Eastward and Northwest
The second shift is the reassertion of national control over spatial data. Cadastral records, high-resolution terrain models, and utility network geometry are treated as sensitive infrastructure in a growing number of jurisdictions, which favours domestic vendors such as SuperMap, GeoStar, CHC Navigation, and Hi-Target Surveying Instrument inside their home markets. Global platform vendors keep the technical lead in software depth, but procurement increasingly splits along data-residency lines rather than pure capability lines.
Cost pressure and value-added mix run in parallel, forcing operators to control costs while upgrading product quality to meet rising customer expectations.
Customer preferences are recalibrating toward authenticity and quality: a large share of global consumers is willing to pay a premium for locally sourced, higher-quality options, pushing producers toward more experiential and culturally resonant solutions.
Driving Factors
Global Demand Recovery and Market Competition
Public infrastructure and land administration remain the load-bearing demand driver. Construction accounts for 20.05% of 2025 revenue and government for a further 16.21%, and both budgets are tied to cadastral modernisation, transport corridors, and utility replacement programmes that cannot be executed without survey-grade positional control. The growth rate in these two verticals is moderate, at 5.96% and 7.29%, but their absolute base keeps the installed equipment fleet and the maintenance revenue attached to it expanding.
Intensified competition amplifies the effect, turning products into a strategic brand tool. Leading players leverage premium offerings to reinforce brand value, while challengers monetize value-added services as an ancillary revenue stream.
End-market expansion adds momentum, raising product complexity and value density per unit and strengthening demand for quality logistics and premium inputs.
Operational Transformation Driven by Digitalisation and AI
Transport and logistics is where the growth rate concentrates. At 9.19% CAGR, it outpaces every other vertical because high-definition mapping has moved from a navigation convenience to a safety-critical input for driver assistance and depot automation. HERE Technologies and TomTom compete directly for automotive programmes, while surveying firms supply the ground-truth control networks those maps are registered against, pulling hardware and software demand through the same channel.
This transformation is especially important as labor costs rise and solution complexity grows, allowing leading players to absorb cost pressure while smaller operators face margin deterioration and consolidation pressure.
The strategic consequence is that the market is shifting from a service cost center toward a value-generating capability that supports customer satisfaction and incremental revenue.
Demand Structural Upgrade and Premiumisation
Energy transition and resource digitisation add a third, faster-moving layer. Oil and gas operators use 3D scanning and inertial positioning to monitor pipeline integrity across terrain that is expensive to walk, mining companies apply drone photogrammetry to pit reconciliation and slope stability, and utilities maintain network records that regulators now require to be geometrically accurate. Aerospace and defense posts the fastest vertical CAGR at 10.03%, reflecting demand for persistent Earth observation and precision guidance rather than any change in survey practice itself.
This structural upgrade is pushing the supply chain from standardized delivery toward highly customized systems, increasing solution complexity and raising the value of flexible, data-driven planning and inventory management.
For providers that manage the transition well, a higher-value mix creates clear opportunities to raise revenue per customer and differentiate against competitors.
Taken together, these drivers reinforce one another, keeping the market on a steady structural growth path through 2035.
Global Geomatics Market: Competitive Landscape
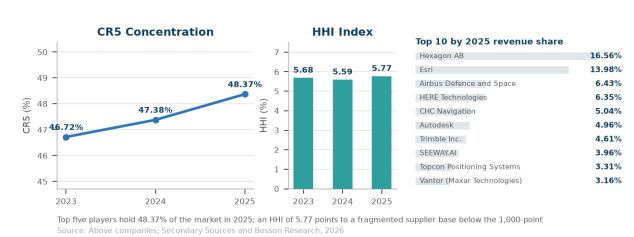
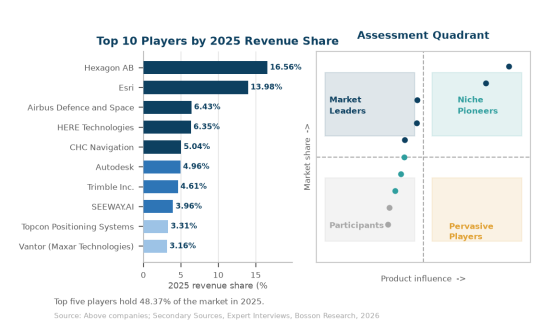
The global geomatics solutions sector exhibits a moderately to highly concentrated competitive structure. The CR5 ratio stood at 48.37% in 2025 while the HHI reached 5.77%, indicating a leader-dominated but regionally dynamic market. Hexagon AB leads with a 16.56% revenue share, followed by Esri at 13.98% and Airbus Defence and Space at 6.43%.
Table 4 Global geomatics solutions market concentration, 2025 (revenue share and HHI)
Company | 2023 | 2024 | 2025 | Type |
|---|---|---|---|---|
Hexagon AB | 17.31% | 16.93% | 16.56% | Tier 1 |
Esri | 13.35% | 12.91% | 13.98% | Tier 1 |
HERE Technologies | 6.69% | 7.06% | 6.35% | Tier 2 |
Airbus Defence and Space | 5.59% | 5.93% | 6.43% | Tier 2 |
CHC Navigation | 3.78% | 4.55% | 5.04% | Tier 2 |
CR5 | 46.72% | 47.38% | 48.37% | |
HHI | 5.68% | 5.59% | 5.77% |
Source: Bosson Research analysis, 2026.
Global Geomatics Market: Market Segmentation Analysis
The research report includes specific segments by region (country), manufacturers, Type, and Application. Market segmentation creates subsets of a market based on product type, end-user or Application, Geographic, and other factors. By understanding the market segments, the decision-maker can leverage this targeting in the product, sales, and marketing strategies. Market segments can power your product development cycles by informing how you create product offerings for different segments.
Key Company
Esri
Airbus Defence and Space
HERE Technologies
CHC Navigation
Autodesk
Trimble Inc.
SEEWAY.AI
Others
Market Segmentation (by Type)
Hardware
Software
Market Segmentation (by Application)
Construction
Government
Geographic Segmentation
North America
Europe
Asia-Pacific
South America
Middle East and Africa
Key Benefits of This Market Research:
Assessment of the global geomatics solutions market size, 2025 and forecast to 2035.
Comprehensive analysis of the geomatics solutions market by offering type and by application.
Regional breakdown covering North America, Europe, Asia Pacific, South America and the Middle East & Africa.
Company profiles of the leading geomatics solutions suppliers with revenue share and tier positioning.
Supply-side analysis of capacity, cost structure and margin trends across the geomatics solutions value chain.
Demand-side analysis of buyer requirements, procurement practice and switching behaviour.
Five-year historical context and a ten-year forward view with a reconciled CAGR.
Actionable implications for suppliers, distributors and investors active in the geomatics solutions market.
Key Reasons to Buy this Report:
Quantified geomatics solutions market sizing from 2025 to 2035F with a single, reconciled base case.
Segment-level sizing for every offering type category, with share and CAGR shown side by side.
Application-level sizing showing which end-use vertical end uses carry the growth.
Regional and country-level analysis identifying where demand is shifting fastest.
Competitive landscape with revenue share, tier grouping and concentration metrics.
Profiles of the ten largest players, including positioning and strategic direction.
Value chain mapping from upstream inputs to end customers, with margin pools identified.
Technology and product development trends shaping the next investment cycle.
Policy, tariff and regulatory developments that change the economics of supply.
Pricing analysis covering contract structures and cost pass-through mechanisms.
Demand drivers and headwinds quantified, not just listed.
Merger, acquisition and partnership activity mapped to strategic intent.
Primary research findings from buyer and supplier interviews across the geomatics solutions market.
A defensible forecast model, transparent assumptions and a clear view of downside risk.
Customization of the Report
In case of any queries or customization requirements, please connect with our sales team, who will ensure that your requirements are met.
Note: this report may need to undergo a final check or review and this could take about 48 hours.
Chapter Outline
Chapter 1 defines the geomatics solutions market, sets out the research scope, methodology and data sources.
Chapter 2 provides the executive summary: market size, growth rate and the headline findings.
Chapter 3 analyses the competitive landscape of the geomatics solutions market, including share, concentration and M&A activity.
Chapter 4 examines the value chain, from upstream inputs through manufacturing to end customers.
Chapter 5 assesses the technology landscape and the product development pipeline.
Chapter 6 sizes the market by offering type, covering revenue, share and growth potential for each type.
Chapter 7 sizes the market by end-use vertical, identifying which end uses are expanding fastest.
Chapter 8 covers pricing structures, cost drivers and margin trends across the geomatics solutions market.
Chapter 9 details production and supply in the major countries and regions, with statistics on leading producers.
Chapter 10 analyses regional demand and the outlook for each of the five main regions.
Chapter 11 profiles the leading companies, their capacity, products and market positioning.
Chapter 12 reviews merger, acquisition and partnership activity and what it signals about consolidation.
Chapter 13 sets out the forecast, the assumptions behind it and the main risks to the outlook.
